Author of this article: Andreas Soller
Kano Model
The Kano Model explains how product features influence user satisfaction by grouping them into four categories: Must‑be, Performance, Attractive, and Indifferent. It uses a structured questionnaire to understand how users feel when a feature is present versus absent, helping teams prioritize what truly matters. The article also introduces DuMouchel’s continuous analysis, which assigns numerical values to responses to more precisely map features on a satisfaction–functionality graph.
8 min read (1915 words)
Kano Model

The Kano Model was created by Kano Noriaki, a professor of quality management at the Tokyo University of Science in 1984 to understand how users perceive the value of certain product capabilities.
In this article I want to provide a brief overview of the methodology. For a detailed reference and different ways to evaluate the results, I recommend The complete guide to the Kano model.
Why using the Kano Model?
The Kano method helps to answer:
- How do we measure satisfaction with certain features?
- How do we understand how those features are perceived by users?
- What features will deliver a wow effect?
- What features must be included to satisfy the basic expectations
With this method it is easy to group features in four categories based on satisfaction and functionality and visualize it as two dimensional graph. This will support decision making but will not provide an answer why users see it this way. Answering the why-question will require additional research work.
How does it work?
- Craft a survey with each feature listed separately
- Participants can select a predefined response if the feature would be present or absent
- Data is analyzed and categorized to support the decision making process
The four Kano categories
Categories of the Kano Model
Configure columns
No results found |
Indifferent

Indifferent features are those that users don’t care about. They don’t increase satisfaction when present, and they don’t decrease satisfaction when absent.
Takeaway
Indifferent features are features we should avoid working on as those result in sunk costs.
Must-be

Must-be or basic expectation features are features that are expected by default. If they are missing, users feel frustrated or even betrayed. If those features are there, users will not compliment you, they simple assume that those features should be there. Identifying must-be features is crucial as this helps to understand the minimum feature set you must invest in.
We expect from a phone that we can easily make a phone call. If the interface of a smart phone makes it hard to make simple calls or the device gets frozen, they will simply return the product.
Takeaway
Must-be features are features that are simply expected. This is the minimum set of features that have to be there to not dissatisfy users. Missing basic expectations causes extreme frustration and opens the door for competitors.
Performance

Performance are the more the better features. Satisfaction rises as performance improves and drops as performance weakens.
How long the battery of your phone lasts under heavy use or how fast the phone charges has a direct impact on satisfaction. The same is true for Wi-FI range and speed, audio quality, etc.
Takeaway
Performance features are not mind-blowing but are noticed, compared and valued.
Attractive

Attractive features (delighters or exciters) are features users don’t expect. So, users will not get upset if those features are not there but when they are there, satisfaction jumps exponentially. They create the wow, I did not know the product can do that or hey, that’s nice feeling.
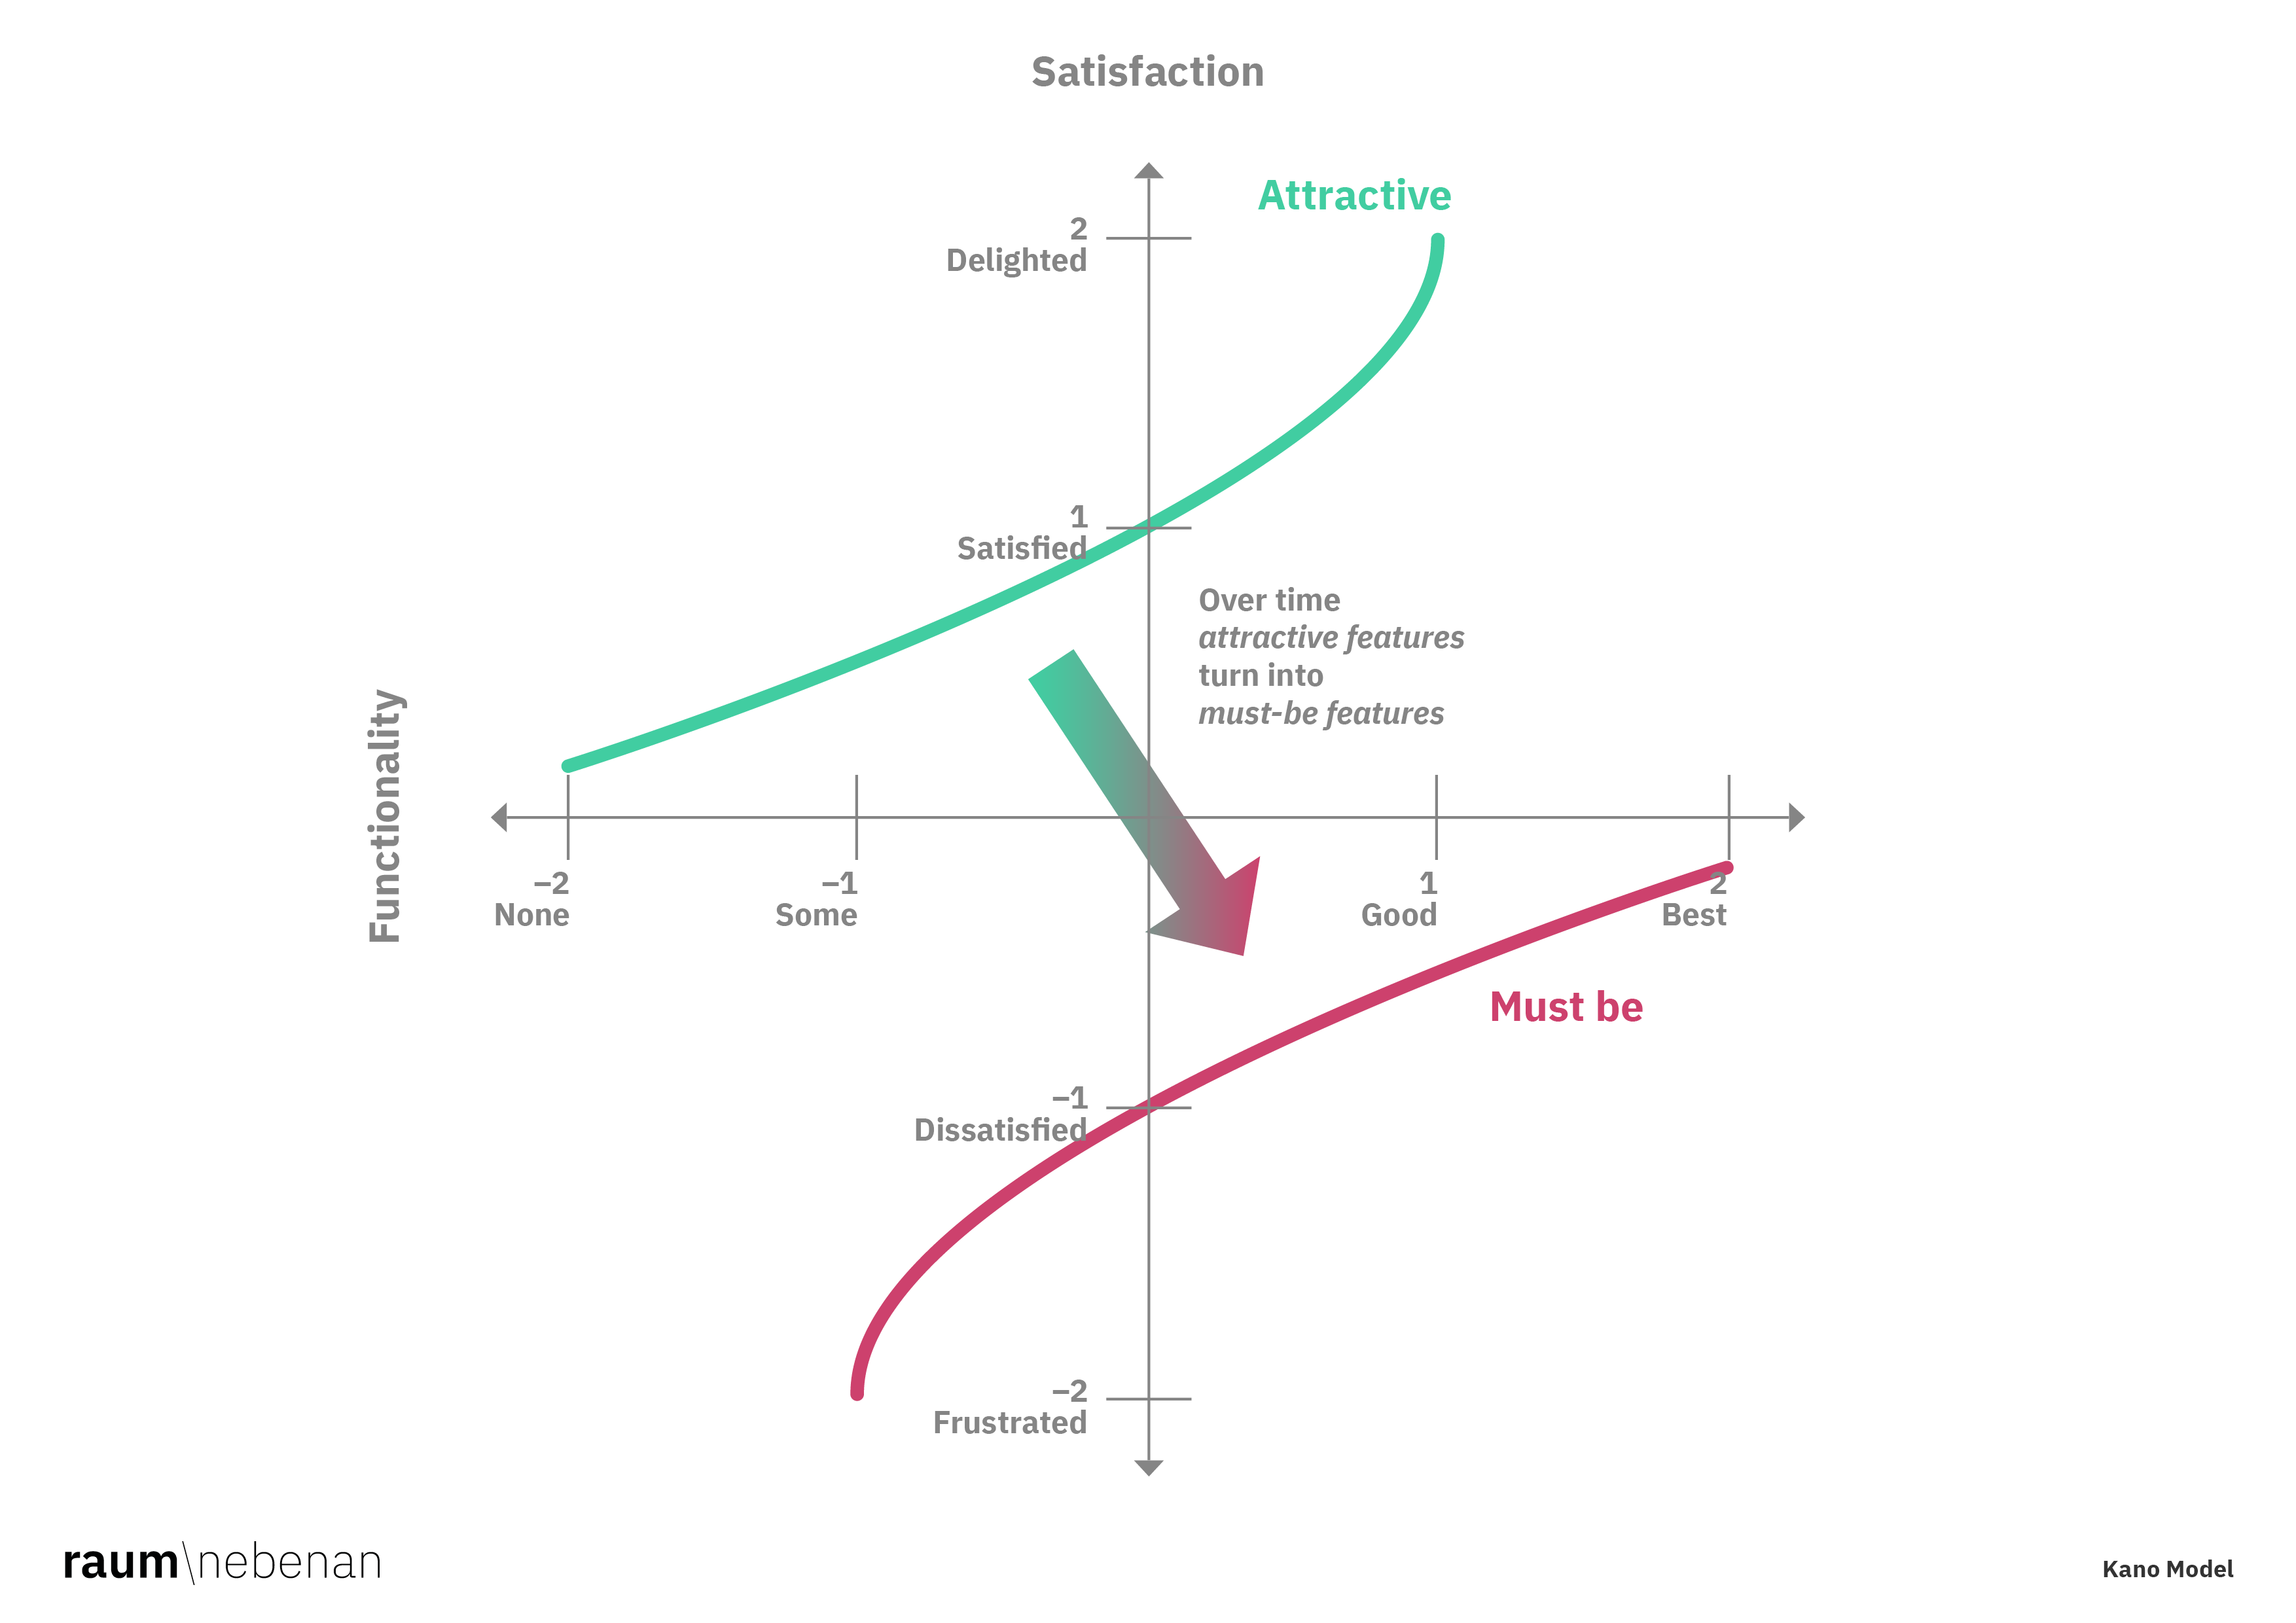
Imagine 2007, a user switching from any mobile phone to an iPhone 1.0. The additional capabilities and user interface of a smart phone felt mesmerizing – wow. Today, being able to interact with your phone in a convenient way, take pictures, browse the internet are elementary features nobody would market anymore. They are simply expected and not having those features would immediately create frustration.
Same holds true for 2001, where WiFi in hotel rooms was still news. Even hot water in a hotel room has been a wow factor at some time. The important aspect is, that attractive features turn into must-be or performance features over time.
Takeaway
Attractive features create joy, loyalty and positive word-of-mouth. They are the reason people say: you have to try this product. It’s awesome or this is why I stay with this brand..
Kano survey
Functional / Dysfunctional question

You can either show (mockups), offer a functional prototype or describe 15–20 features.
For each feature ask
- Functional aspect: If you had (feature), how do you feel? (positive or functional question)
- Dysfunctional aspect: If you didn’t have (feature), how do you feel? (negative or dysfunctional question).
The participant must provide the Kano rating for each question:
- like: I like it
- expect: I expect it / It should be that way
- neutral: I’m neutral / I don’t care
- tolerate: I can tolerate it / I can live with it
- dislike: I dislike it
Include a test-run example with explanation at the beginning to allow participants to familiarize themselves with the tool.
Prefer experience or showing the features over describing the features. Let us assume, you want to find out the satisfaction of a certain file upload. The closer it will be to the real experience, the better users will be able to provide feedback.
Kano question examples
Configure columns
No results found |
Self-stated importance question
Often the Kano questions can be optionally extended with a self-stated importance scale from 1 (least important) to 9 (most important) to get an indication how important this feature is for the participant.
How important is it or would it be if (feature) exists?
Self-stated question scale (1–9)
Configure columns
No results found |
Evaluation
First,
- remove incomplete pairs, where not both questions have been answered and
- remove speeders that have an unrealistically short completion time
For evaluation purposes there are two more categories:
- Questionable: someone has not fully understood the described feature or question. This is the case if we get conflicting responses such as Like for both questions.
- Reverse: the proposed feature is the opposite of what the user wants. This is the case of someone says, he dislikes the functional version and like the dysfunctional version. In that case the participant is not interested in the offering at all and perhaps wants even the opposite.
Categories for the evaluation
Configure columns
No results found |
Method 1: discrete analysis with the evaluation table
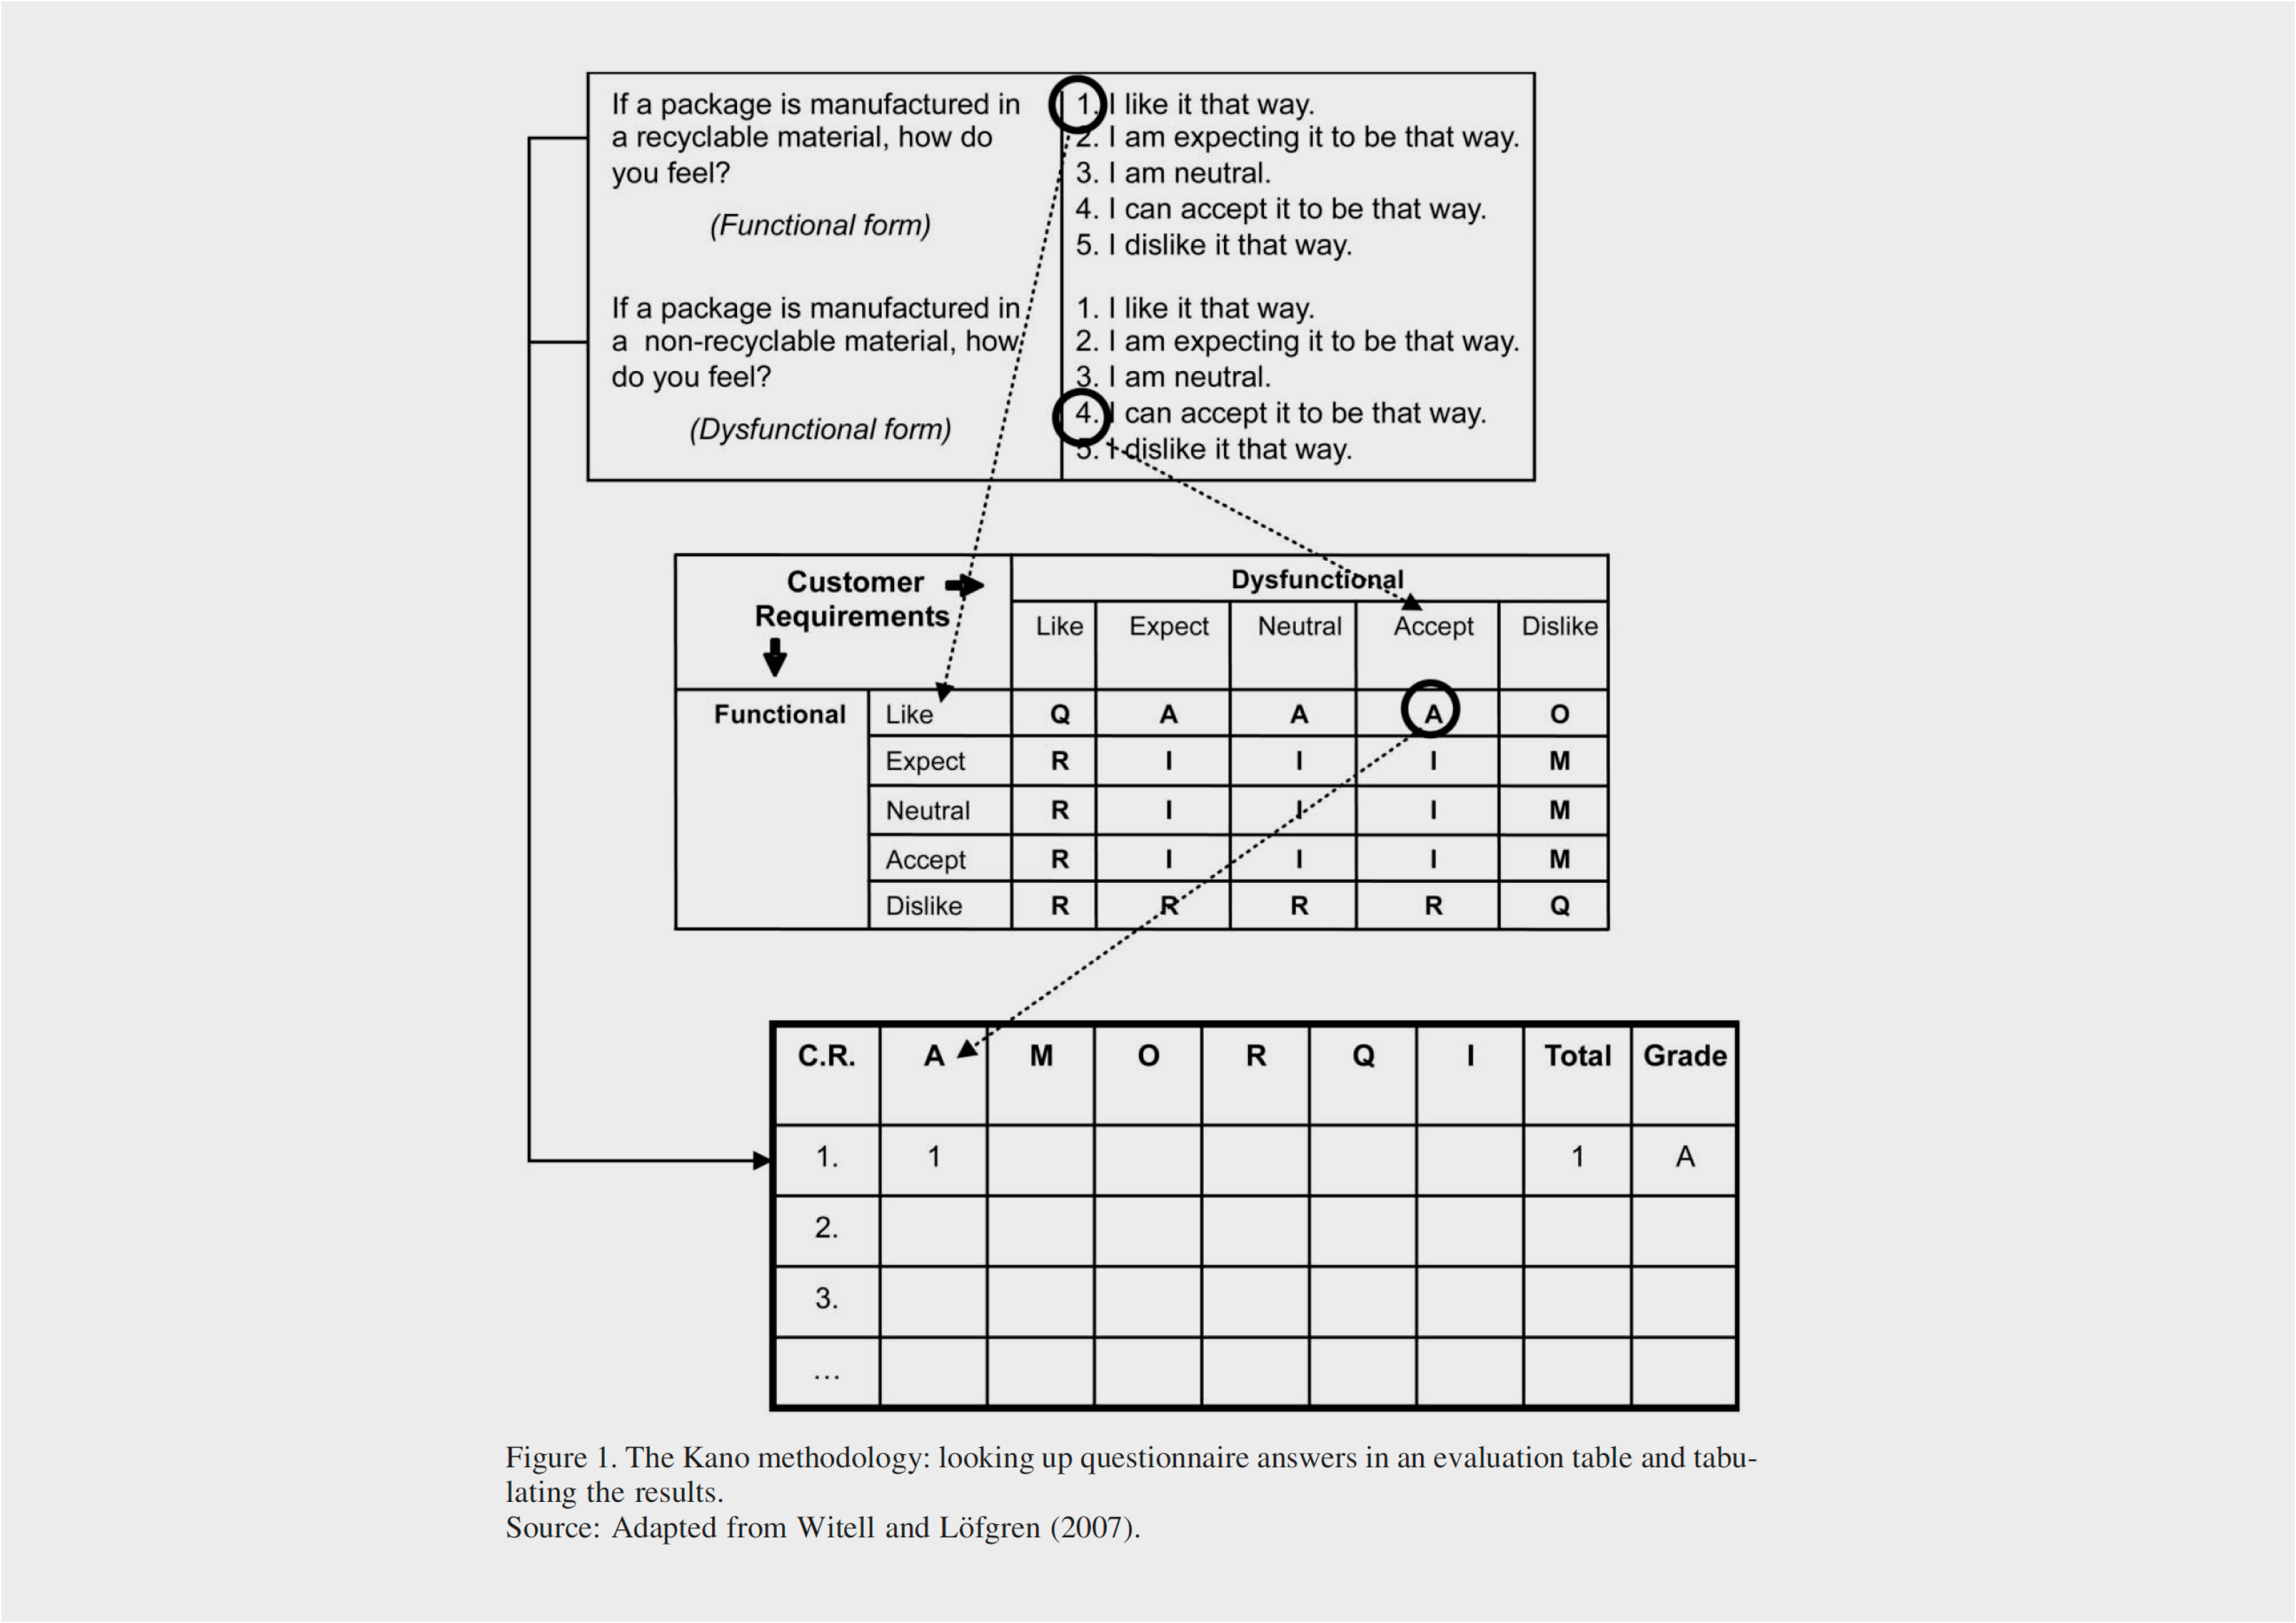
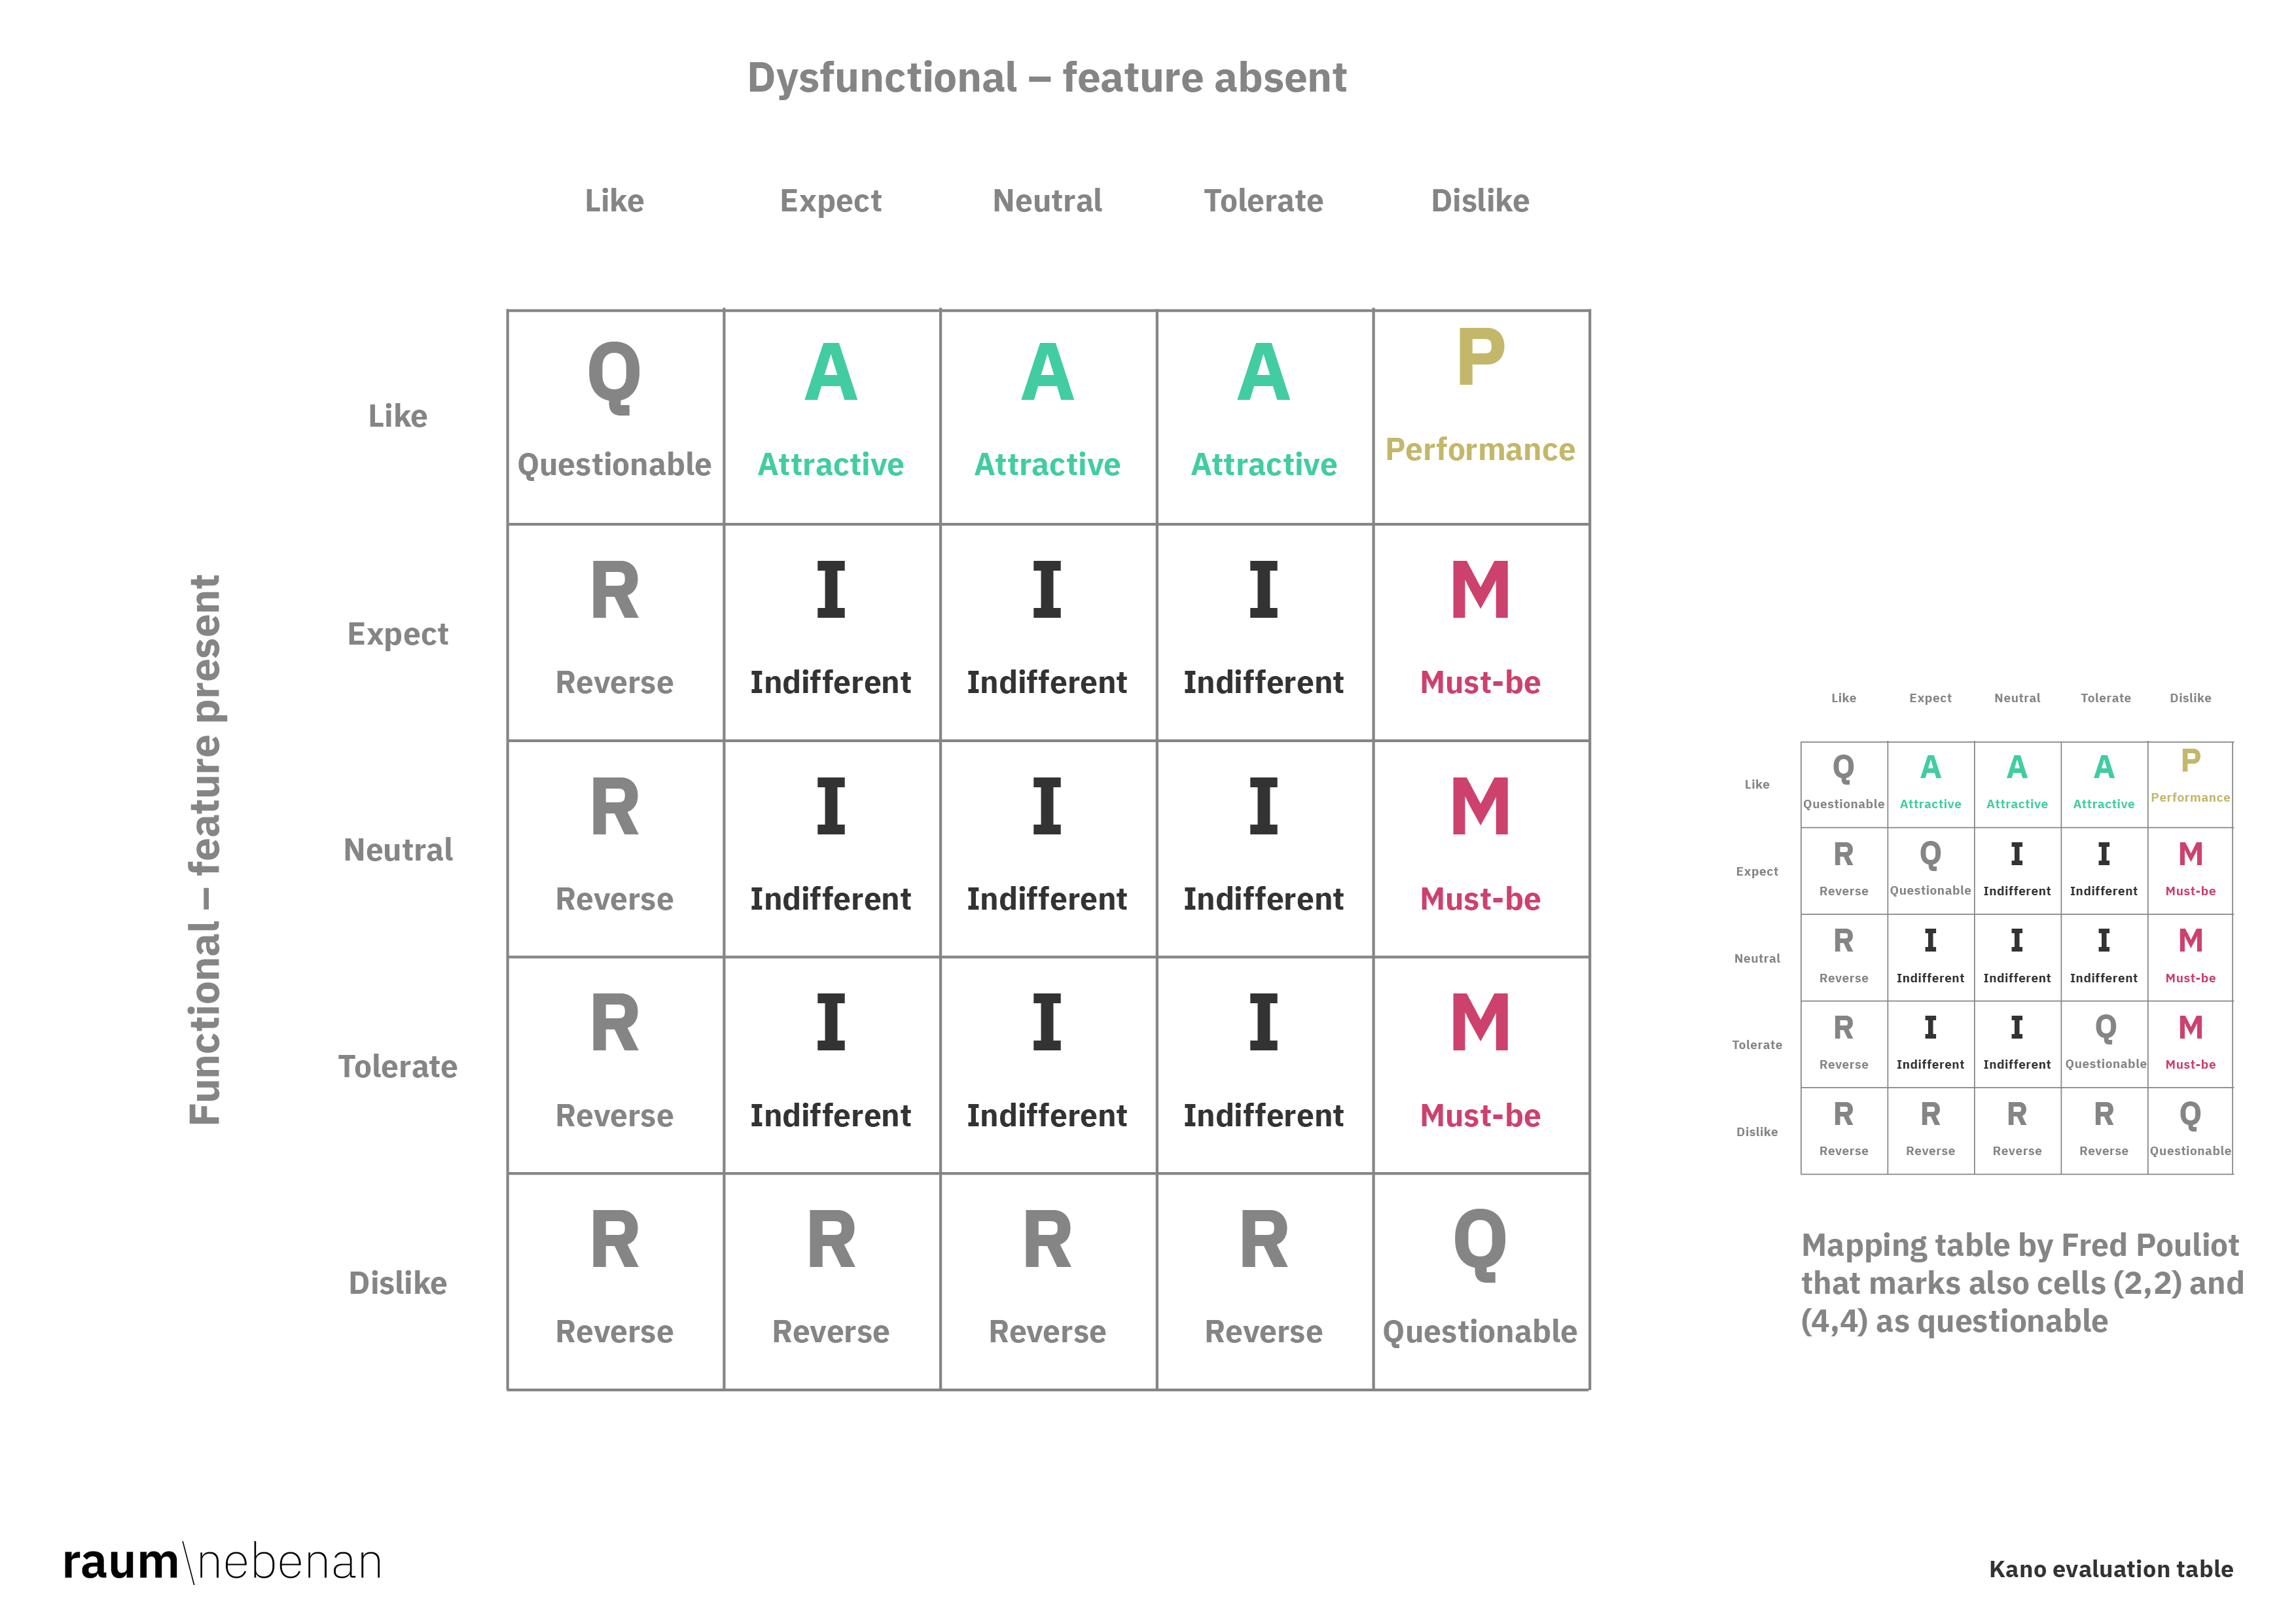
Step 1: Classification
Classify each answer pair to the six categories with the evaluation table.
- Functional: Feature present
- Dysfunctional: Feature absent
Original evaluation table
Configure columns
No results found |
Pouliot adaption
Configure columns
No results found |
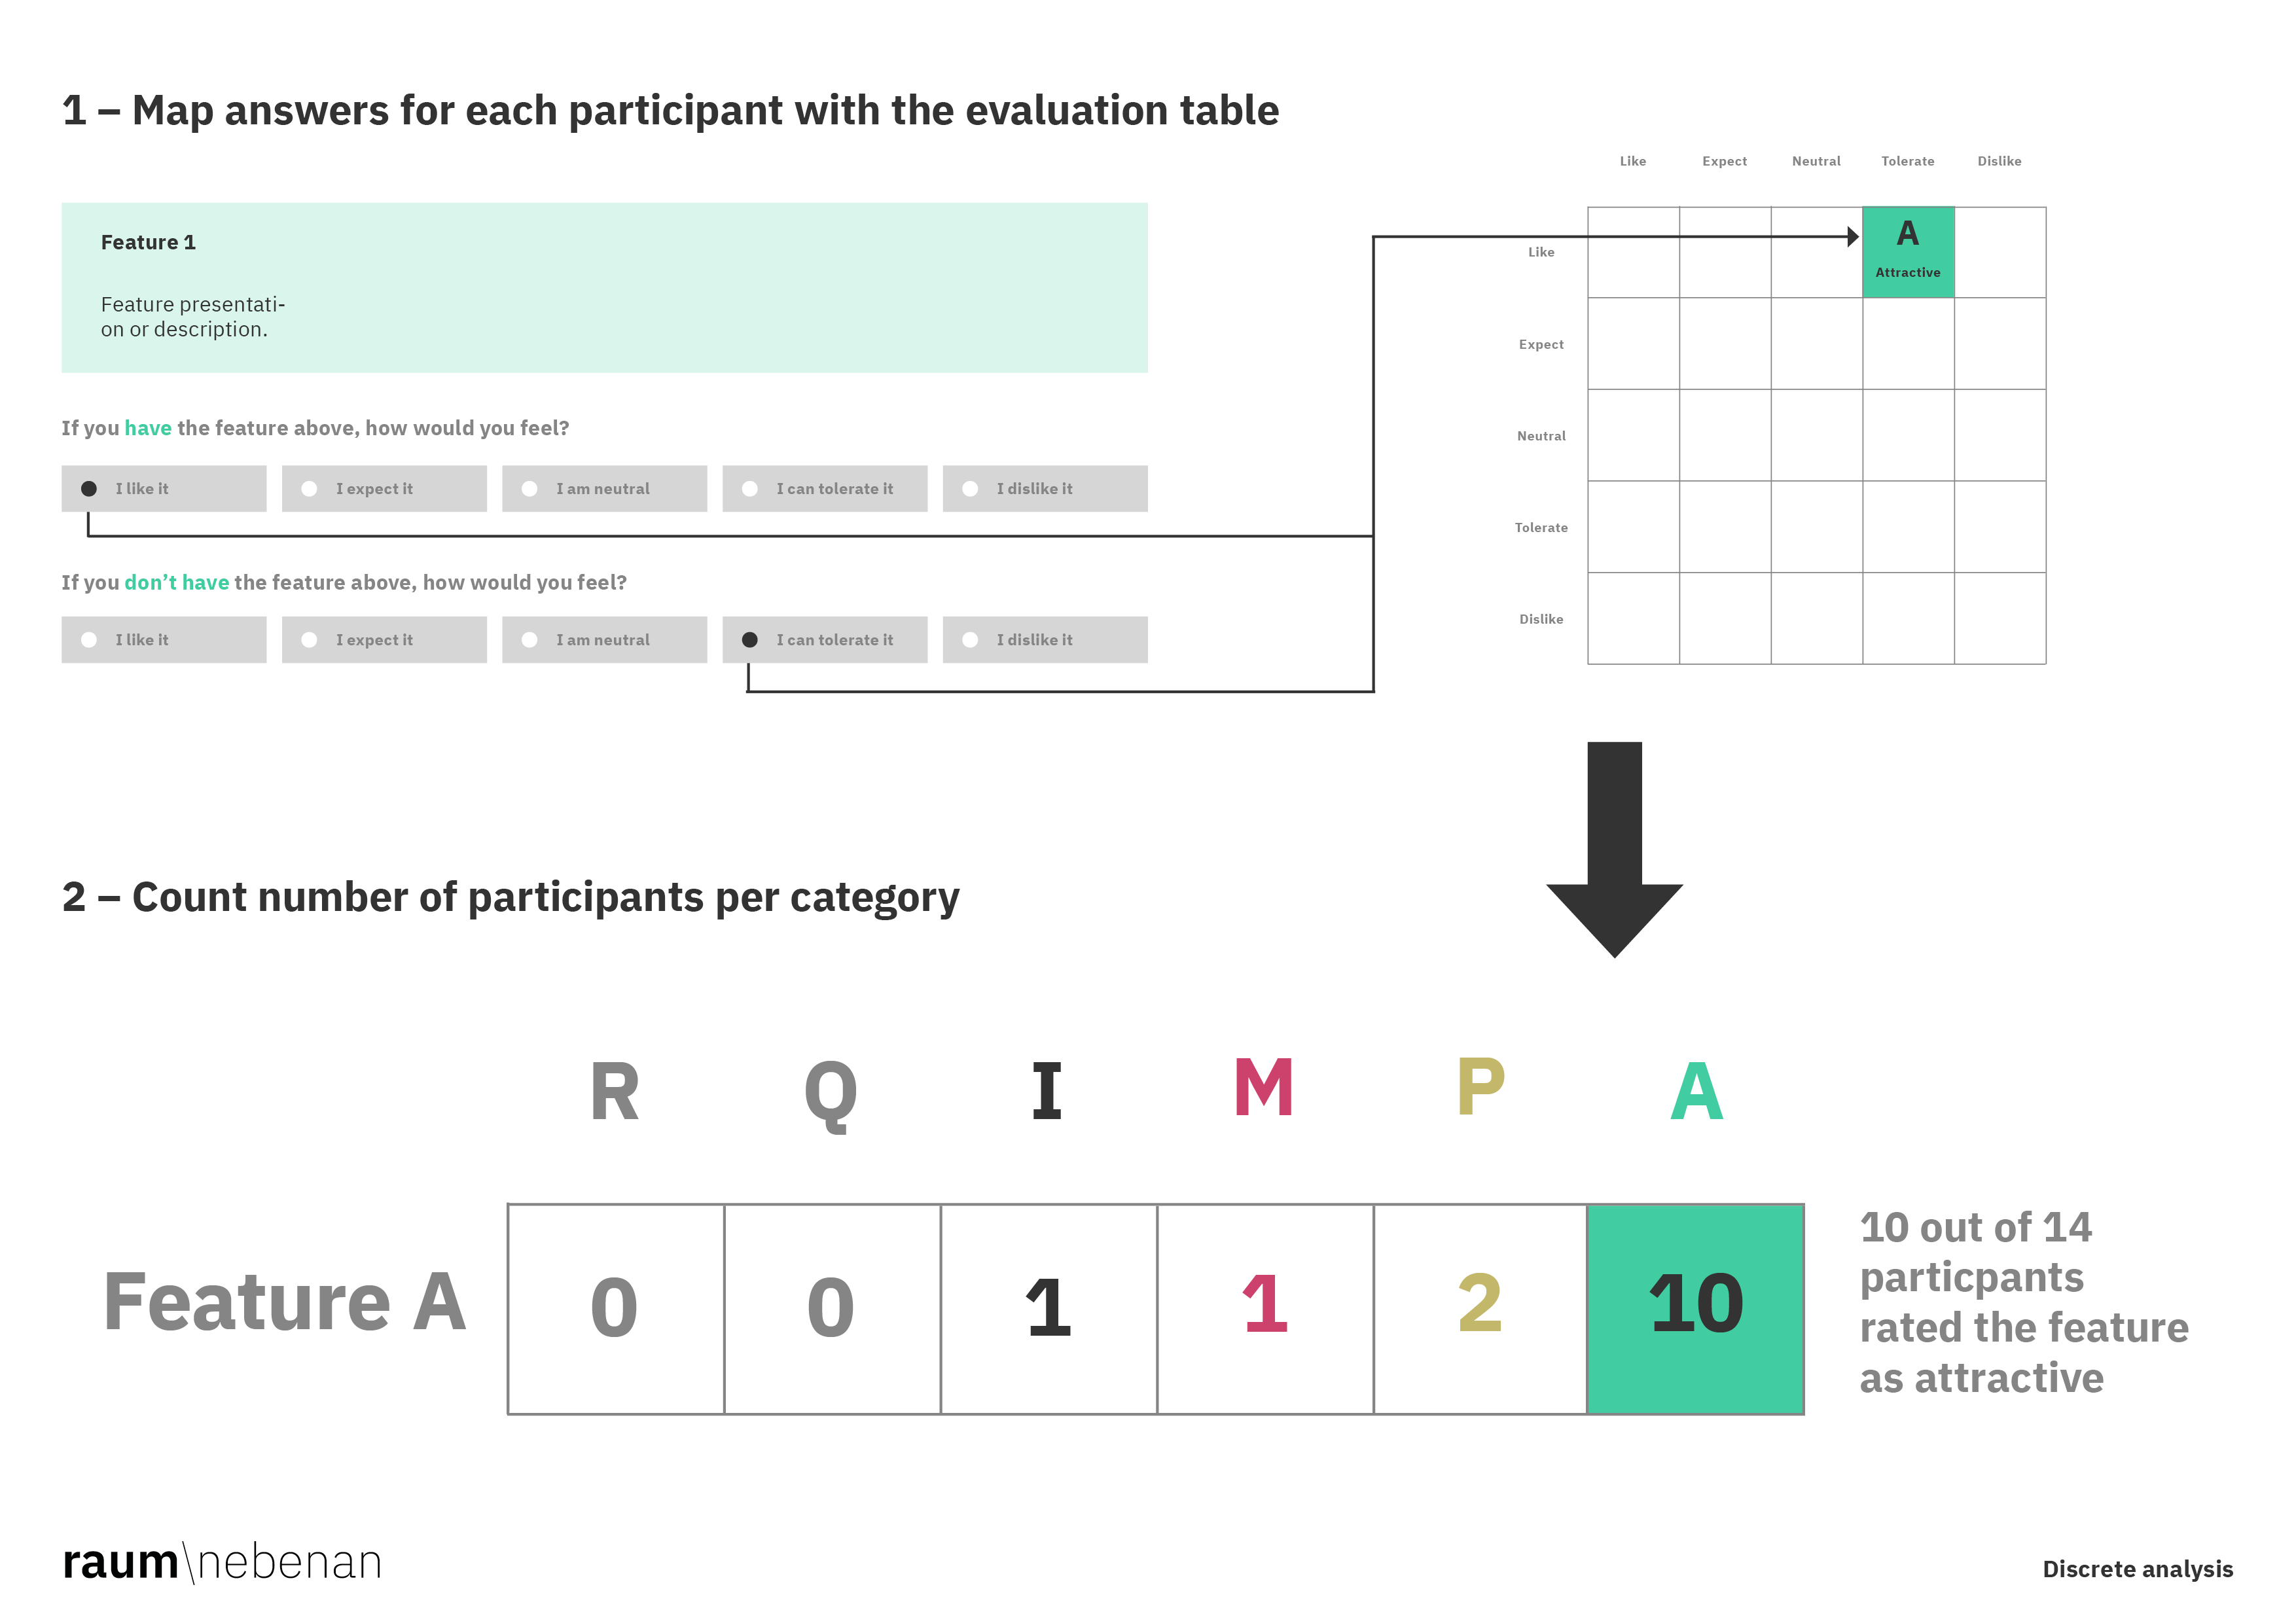
Step 2: Count
Simply count the number of participants per category.
Method 2: continuous analysis
The original Kano analysis uses discrete values. With discrete values, data in between is lost.
Therefore, William DuMouchel introduced a continuous calculation. He assigns a score to each functional and dysfunctional answer and considers reverse results and questionable data. Reverse response indicate that the users want exactly the opposite of what has been proposed. Questionable data refers to invalid or contradictory answers.
Step 1: Map each response to the correct values
Kano rating
Configure columns
No results found |
Step 2: calculate the averages
Calculation example
Configure columns
No results found |
Functional sum: 4 + 2 + 4 + 0 – 2 = 8 Average (sum / number participants): 8 / 5 = 1.6
Dysfunctional sum: 4 + 4 + 4 + 2 + 0 = 14 Average (sum / number participants): 14 / 5 = 2.8
Step 3: Map the feature to the graph


Closing remarks
Keep in mind that the Kano Model is a qualitative research tool. Therefore, don’t get misled by the numbers and use the Kano results alongside other research data.
Although the Kano Model will not be able to give you answers, why participants rate a certain feature with a certain category, it provides you a snapshot in time to understand what features bring what kind of value (satisfaction) to your users.
References and further reading
- Berger, C., Blauth, R., Boger, D., Bolster, C., Burchill, G., DuMouchel, W., Pouliot, F., Richter, R., Rubinoff, A., Shen, D., Timko, M., and Walden, D. (1993) Kano’s methods for understanding customer-defined quality. Center for Quality of Management Journal 2:2–36.
- Kano Noriaki, Seraku N., Takahashi F. and Tsuji S. (1984) Attractive quality ands must-be quality, The Journal of the Japanese Society for Quality Control, 14 (2), pp. 39-48, Open access: https://scispace.com/papers/attractive-quality-and-must-be-quality-2uvbgvliyt
- Spool, Jared (2013). Using the Kano Model to Build Delightful UX, speech at Delight 2013, YouTube: https://www.youtube.com/watch?app=desktop&v=ewpz2gR_oJQ
- For a full reference of the Kano Model I recommend the following website: The complete guide to the Kano model https://kano-model.proofofthepudding.be (25.12.2025)
- Witel, lars; Löfgren, Martin and Jens J. Dahlgaard (2013): Theory of attractive quality and the Kano methodology – the past, the present, and the future, in: Total Quality Management and Business Excellence, Vol 24. No. 11, p1241-1252, http://dx.doi.org/10.1080/14783363.2013.791117
- Warje, Kira / The Decision Lab: The Kano Model, Website: https://thedecisionlab.com/reference-guide/design/kano-model (25.12.2025)
- Zacarias, Daniel (2022): The complete guide to the Kano Model. A step-by-step, in-depth guide to using the Kano Model to prioritize your backlog for customer satisfaction and delight, Version 1.3, Webpage: https://foldingburritos.com/blog/kano-model/. Next to an excellent explanation you find a Microsoft Excel download for the evaluation. (25.12.2025)
How did you rate this article?
Thank you for your feedback.